Plot Diagnostic Visualizations for LMDT
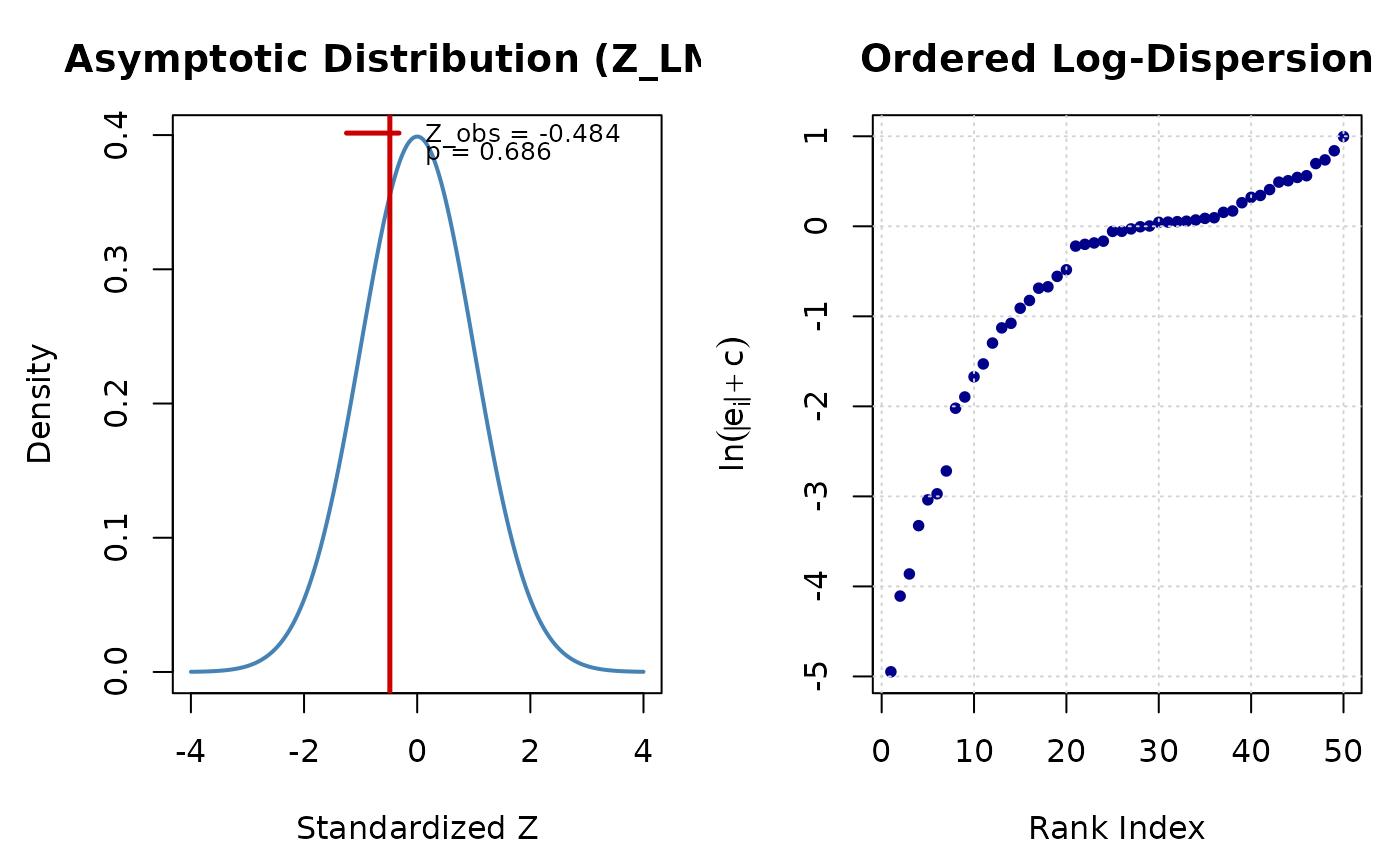
plot.lmdt.RdProduces diagnostic plots displaying the null distribution of the test statistic (under bootstrap/permutation or asymptotic Gaussian) and the ordered log-dispersion profile.
Usage
# S3 method for class 'lmdt'
plot(x, ...)